The raster interface is a nice way to render very pixel-exact charts.
I'm playing with new media for visualisations on the web. I have a lot of experience with WebGL - the 3d context for the HTML5 canvas, but I'd never tried the 2d context. I just assumed that the 2d version would naturally be a vector-drawing API in 2d, as a kind of Flash replacement, but it isn't! It's an old-fashioned pixel-pushing raster graphics interface. This is fine if you are happy with using fixed-size canvas areas in pixels, but I suspect is probably a mistake given the rapidly growing resolutions of modern displays. It feels like a poorly thought-out design decision by the w3c, but hey, they still haven't figured out to format a table in HTML 30 years later so whatever.
Anyway, it's quite fun playing with this very, very old-fashioned graphics interface - it's like how games developers would have worked with graphics in the 80s and early 90s. In my previous post I was looking at something similar in C with a chart-rendering toy, so I thought I'd re-create that in HTML5 with the 2d canvas.
In the past vector and raster chart libraries have annoyed me because it's hard to get the axes exactly aligned in a sensible way, and often your points or tics will be slightly off the centre of pixels which will either be obviously wrong by 1 pixel, or prompt some, in my opinion, inappropriate anti-aliasing which blurs over the points in a chart, which you want to be exact - you don't want some crosses to appear larger than others just because they aren't exactly centred on a pixel. In this case it's quite nice to have total control over chart construction right down to the pixel level. It shouldn't be hard to do this either - it's just a bunch of lines.
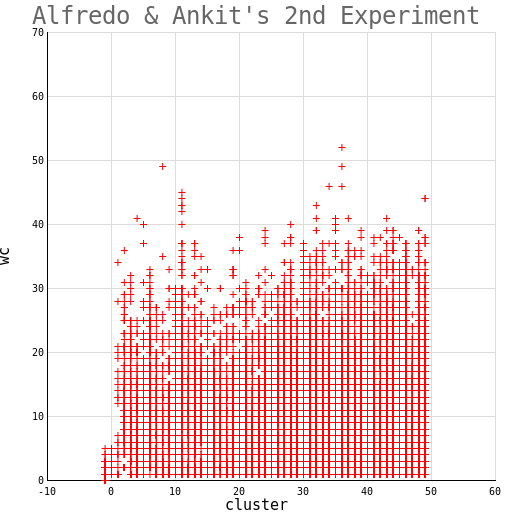
I wrote a chart renderer fairly quickly (about 3 hours) in canvas 2d from scratch, and did a scatter plot of some colleagues' experiment data (pictured). The drawing API has functions to draw lines and pixels and nice text - that's all we need!
My main misgiving is about the raster nature versus resolution. For smaller resolution displays it probably makes sense to super-sample the rendering to 2 or 4 times larger than the canvas area, downsize, and interpolate because even 512x512 pixels is not a lot of space for drawing lines, and that's about half of a typical web-page covered by one chart. This isn't a problem on the 2k and 4k displays coming out.
A nice side-effect of canvas 2d is that you can right-click to save any rendering to a PNG file. Due to the pixel-and-lines nature of rendering, it's also fairly amenable to conversion to SVG.