[index]
Anton's Research Ramblings
Bresenham's Line-Drawing Algorithm (1962)
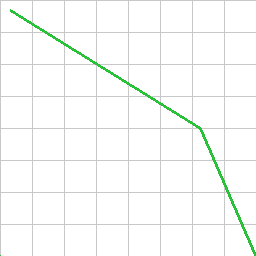 It's immediately obvious what one application of this algorithm is
from my little test programme's output here, but it can also be used for
determining things like line-of-sight paths through lattice-based environments
with some limitations. I draw two separate lines here of thickness 3.
It's immediately obvious what one application of this algorithm is
from my little test programme's output here, but it can also be used for
determining things like line-of-sight paths through lattice-based environments
with some limitations. I draw two separate lines here of thickness 3.
First of all, the Wikipedia article for this algorithm, like all Wikipedia
articles for mathematics, is unreadable rubbish. The nicest article is at this
website: http://www.falloutsoftware.com/tutorials/dd/dd4.htm,
where I find the listing there to be the most robust and general to different
line types also. I re-implement a version of that here and explain my
understanding.
Bresenham's algorithm is a nice way to interpolate a line of pixels between any
two 2d points. Nice because it's fast. You don't need to check every pixel in
each column of the image for its distance from the line equation at a given x
or something to find which pixels to colour. The general idea is:
-
The line to draw is defined by two image locations (start and end x and y in
pixels).
-
Work out which is the "major" axis - i.e. is the line mostly changing in either
x, or y axis.
-
An "error" value is initialised to double the distance |end-start| along
the major axis minus the distance |end-start| along the minor axis.
-
Step (loop) along the major axis, one pixel at a time, from the start to the
end of the line.
-
We plot a pixel at the current x and y point (initialised to the start point).
-
We add double the total line distance along the minor axis to the error value
at every step.
-
If the error value is positive we subtract double the total line distance
along the major axis from the error accumulation, and we also increment the
current minor-axis value by 1 in the direction of the slope e.g. y++ if the
major axis is x, and the line is sloping positively in y.
The error accumulation is a bit odd. Basically what it does is factor the slope
of the line into the decision whether to increment the minor-axis pixel or not
for the next plot point. If we have a slope of 1 then we will get a positive
error value at every step, and therefore the y value of the pixel will increase
by 1 for every increase in x value; a 45 degree diagonal line. If we have a
slope of 0.5 then the error value will only be positive in every second step. I
feel like this could be expressed more naturally with a more traditional slope
calculation evident.
The reason that we use the curious 2 * distance values is because this lets us
use integers for the entire algorithm. Otherwise we have to use floats, and
deal with fractions in the loop.
A limitation of this algorithm is that the line only ever has one pixel in the
minor axis for
any major-axis value. That's okay, but sometimes the mathematical line would
cut through two pixel's boxes within one major-axis pixel
width. In this case it might make sense to colour both pixels, rather than just
the closest one - especially if we are calculating the line for collision
detection or something, rather than just drawing a simple line.
Another limitation is that the line is only ever one pixel thick, and there is
no anti-aliasing. I easily added a thickness to the line by plotting extra
points adjacent to the centre pixel at each plot location - this adds basically
no extra computational cost to the algorithm. Anti-aliasing can easily be added
in as a post-process or even by making the thickness-plots a half-way colour.
Listing: My First Implementation of the Algorithm
I used C and Sean Barrett's stb_image_write.h library to write to a PNG.
There's no particular need for this though - the memory can be dumped directly,
as-is to a binary file and converted at the command line from raw format with
ImageMagick or a similar tool, or copied directly into an OpenGL texture or
something like that for interactive rendering.