Output Data From Programme
- Programme does a printout at every step
- I used a script to repeat runs and put output in numbered files
C code
  // end of step printing and logging
  if (i % printerval == 0) {
    printf("%i\t%i\n", i, gMaps.survivorCount); // step # and survivors left
  }
Bash script: runs.sh
for i in {0..10000}; do
./unlife 1000 100 > result$i.txt
done
I used the parameters to mean "run for 1000 steps and print stuff every 100 steps"
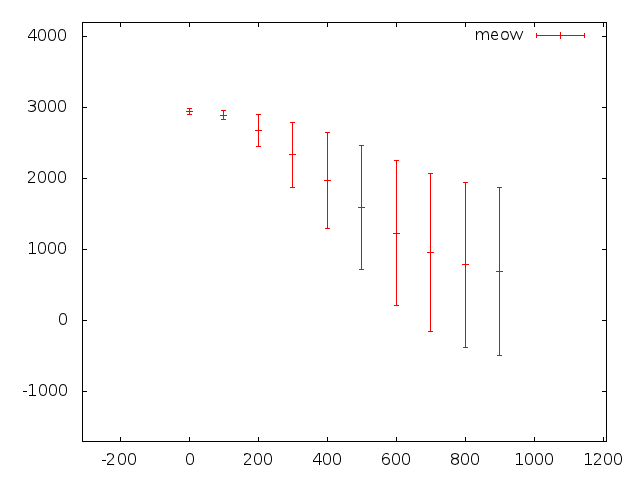
Process Data
- Compute mean value
- Compute uncertainty (I used std error)
- Boil many results files into 1 file with 3 columns
- I wrote a C programme to do that
C code fragment (after tedious file I/O)
for (int i = 0; i < xvalues.size(); i++) {
  // work out sum of y values for each x value
  xvalues[i].calcSum();
  // work out mean for each x value
  xvalues[i].calcMean(count);
  // sum of sq diffs from mean
  xvalues[i].calcSumOfSqDiffs();
  // std dev
  xvalues[i].calcStdDev(count);
  // write to "stats.txt"
  fileout << xvalues[i].x << "\t" << xvalues[i].meanOfYValues
  << "\t" << xvalues[i].standardDev << endl;
}